How to Find the Useful Insights Hidden in Your Spreadsheets
You don't have a data problem. You have a surfacing problem. The insights are already in your spreadsheets, buried under the thousands that aren't.
6 min read • 23 Aug 2026
What Manual Work Is Really Costing Your Business
6 min read • 23 Aug 2026The problem was never collection
Every business we meet believes it needs to collect more data. Almost none of them do. The data that would change a decision this week is already sitting in their spreadsheets, their exports, their systems. The problem isn't that it's missing. The problem is that the handful of findings that matter are buried under thousands that don't, and nobody has time to dig.
More dashboards don't fix that. They just give you more places to not notice the thing you needed to see.
Businesses have spent a decade being told to become data-driven, and they've dutifully collected. What they got was more spreadsheets, not more clarity. The classic result is a data warehouse nobody queries and a BI dashboard nobody opens, because both still require a person to know what question to ask.
Collecting data is easy. Knowing which slice of it is trying to tell you something, this week, without you having to go looking, is the actual hard problem. And it's the one most tools quietly leave to you.
Signal is rare, and it hides
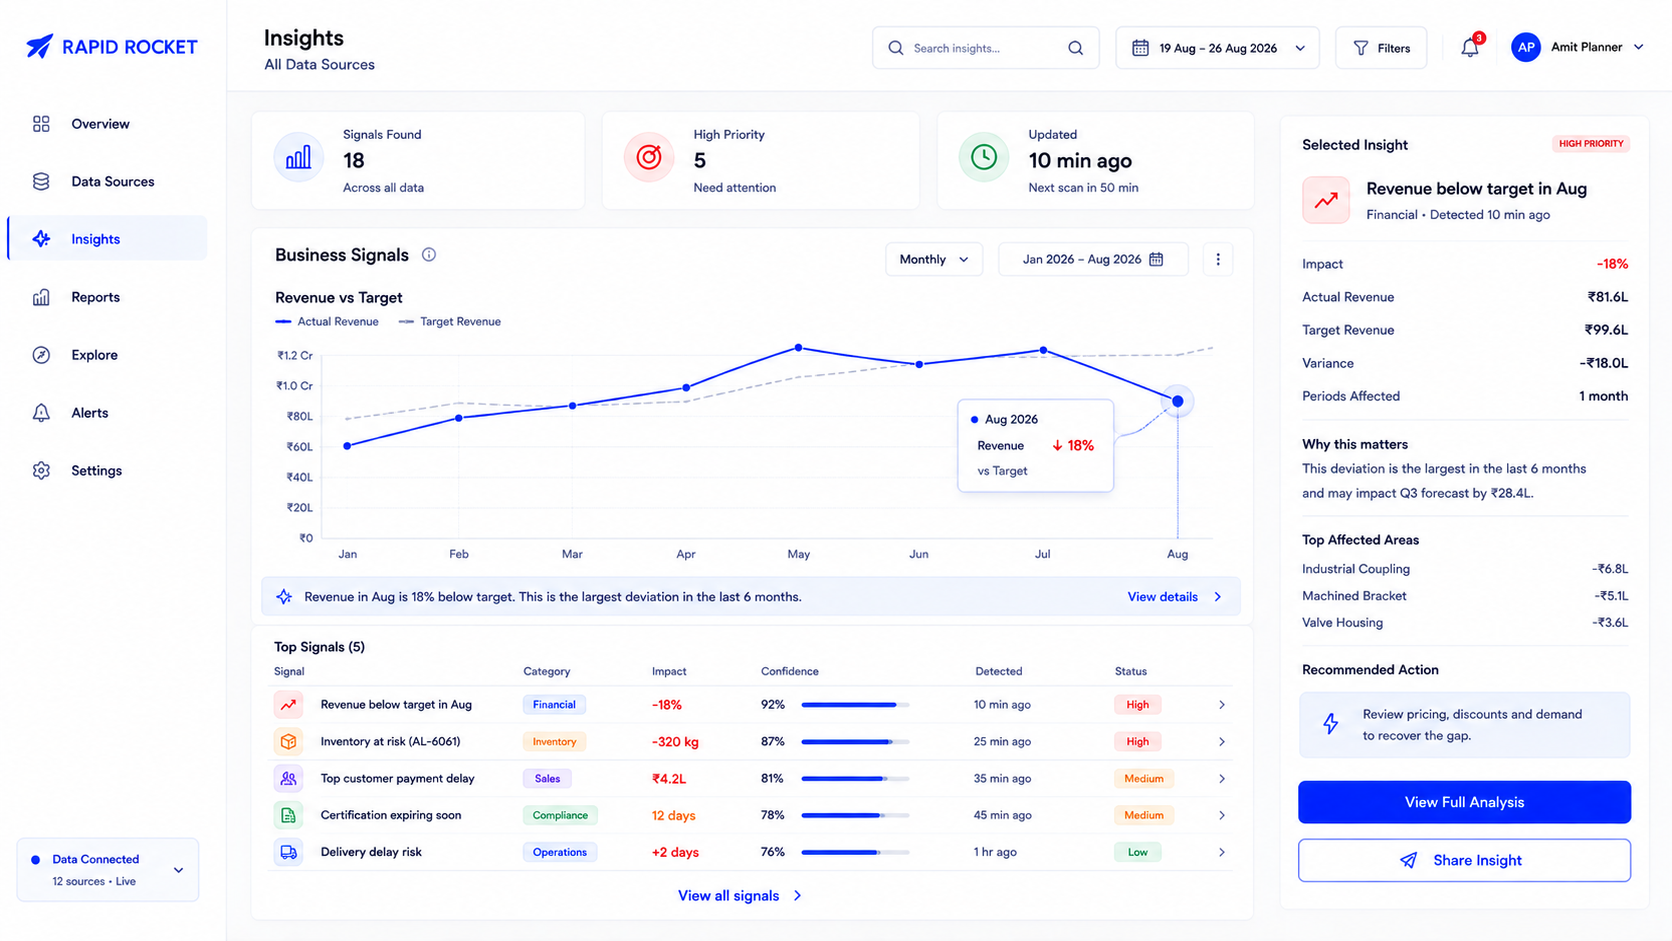
Here's the uncomfortable math. In any real dataset there are thousands of things you could look at: every metric, every segment, every trend, every combination. The overwhelming majority are noise. A tiny number are genuinely worth acting on. A cost creeping up in one region. A customer segment quietly churning. A pattern that only shows up when you cross two tables nobody thought to cross.
Finding those by hand means knowing to look, which means you already half-suspected the answer. The findings that would actually surprise you, the ones worth the most, are exactly the ones you'll never think to search for.
The insight that would change your quarter is the one you didn't know to look for. That's exactly the one manual analysis misses.
Where the model earns its place
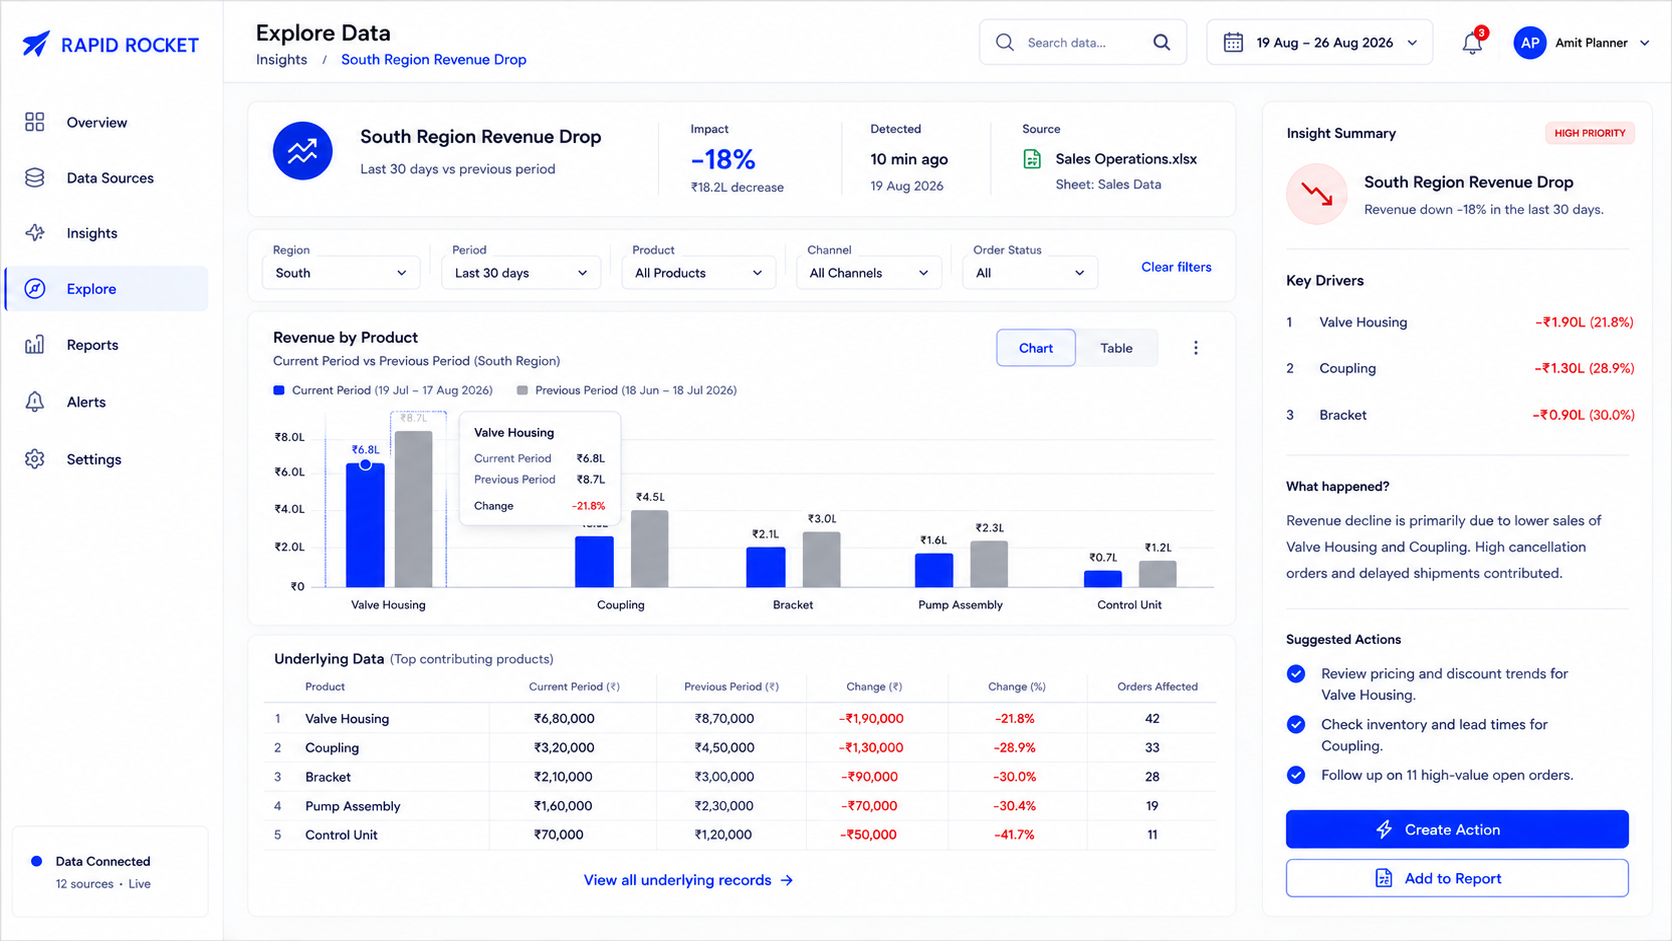
This is the rare spot where a custom model earns its keep honestly. The job is to read across your data, enumerate the huge space of things that could be interesting, and score them, how surprising, how large, how stable, how much of the business they touch, so only the few findings that clear the bar reach a human. Then let someone ask follow-up questions of their own data in plain language instead of writing queries.
That's the moat: not another dashboard you have to interrogate, but a system that does the looking and surfaces the short list worth your attention, on premises when the data is too sensitive to leave the building. The technique matters less than the shift, from you querying the data to the system bringing you the signal.
The test
The question isn't whether you have enough data. You do. It's whether anything in it is quietly telling you something right now that you won't notice until it's a problem. If your honest answer is "probably, but I'd have to go looking," that gap between the signal existing and someone seeing it is the entire opportunity.